
- 3.3B Google searches a day
- 968 million people visit Facebook daily.
- 500 million tweets sent a day
- 75 million daily Instagram users.
Nicky Yates Published on April 25, 2016 5:01 pm
Frequently Asked QuestionsFAQs
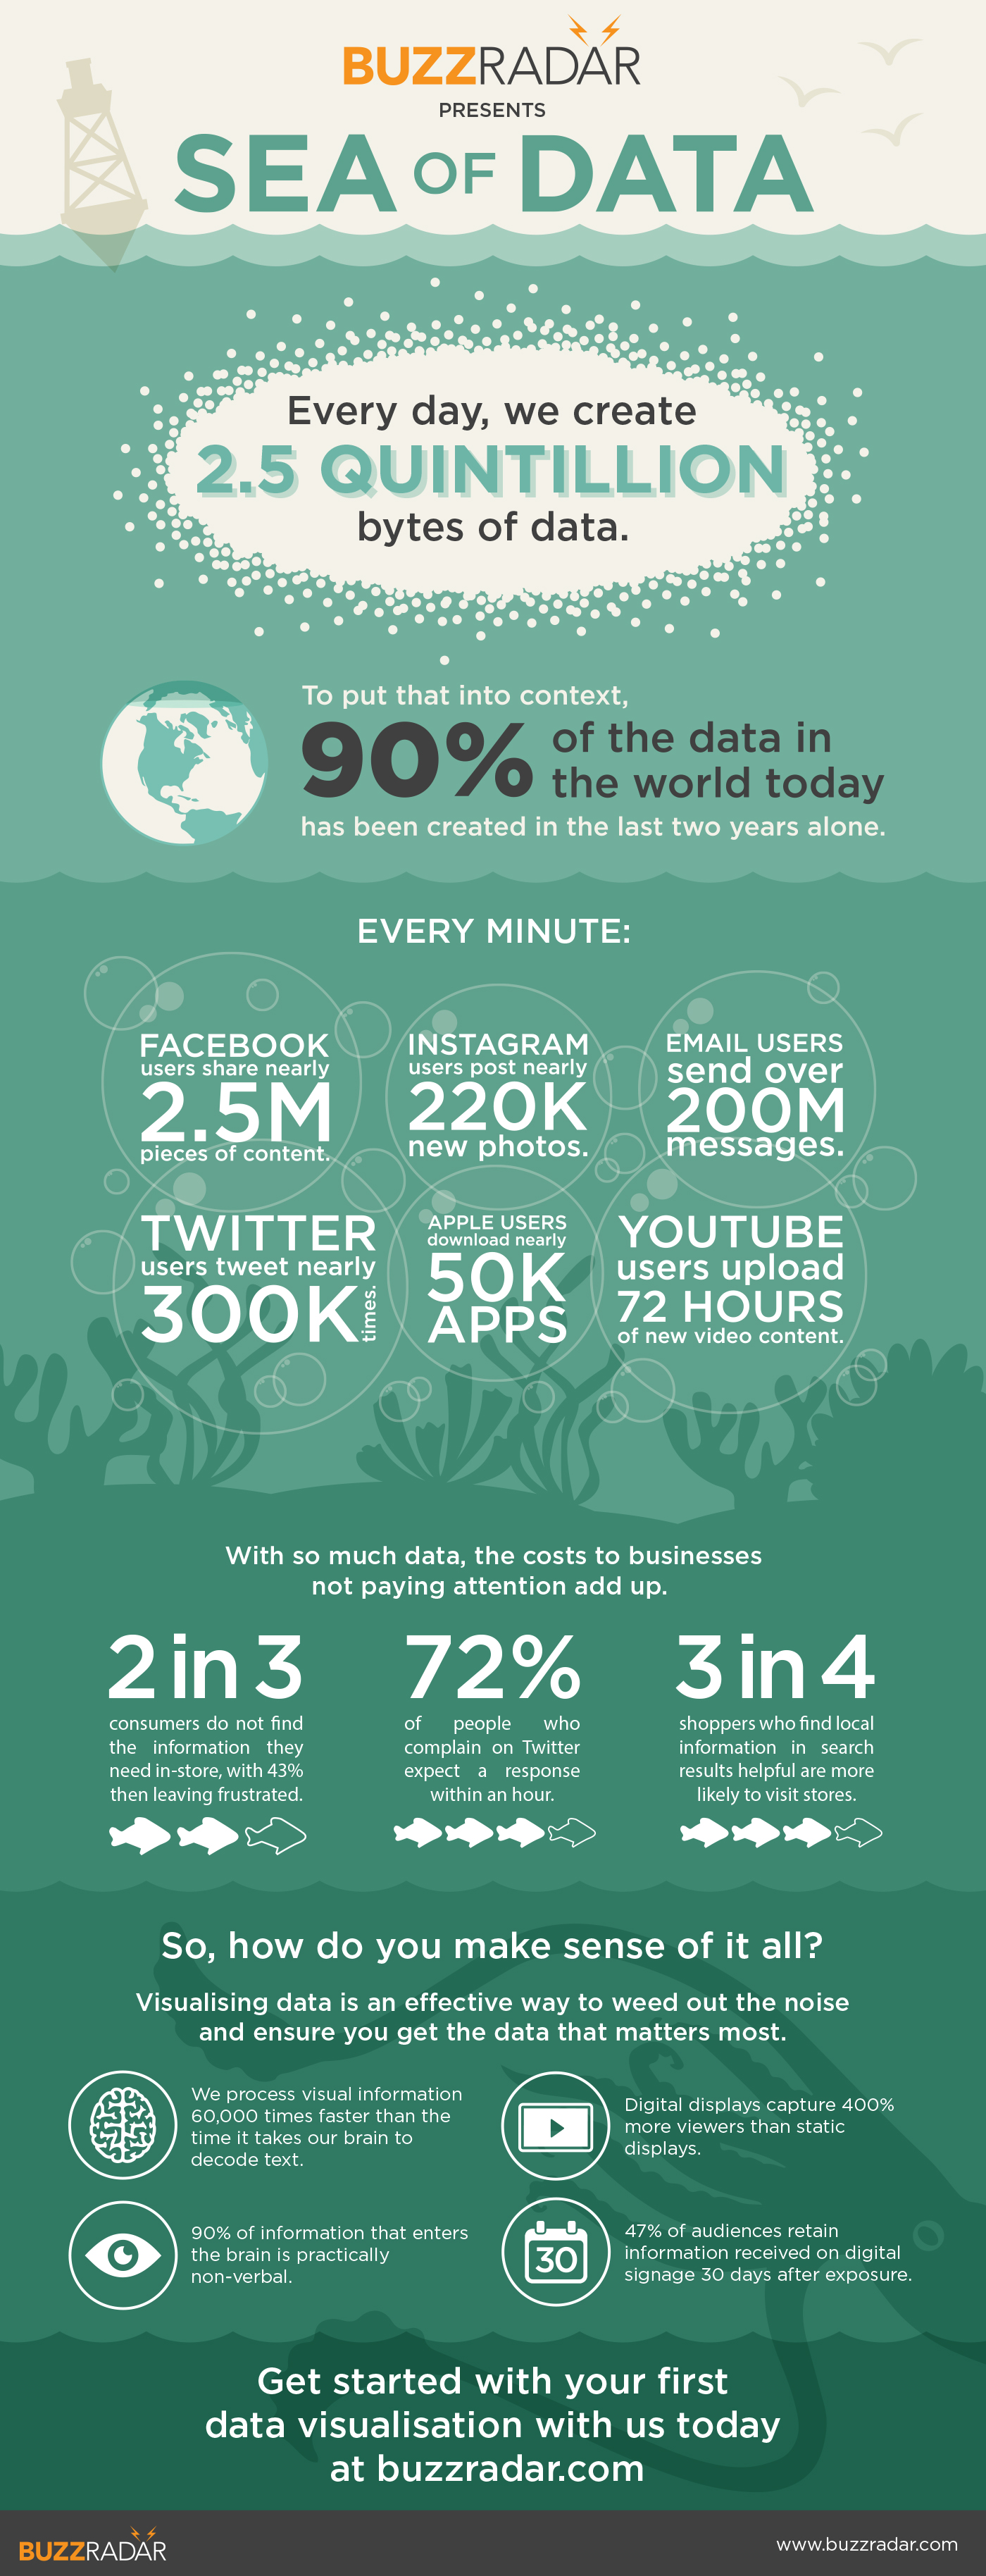
How much data is generated on social media daily?
Social media platforms generate massive amounts of data daily, including 3.3 billion Google searches, 500 million tweets, and 968 million Facebook visits. Instagram alone sees 75 million daily active users contributing to this data stream.
What does social data visualization help with?
Social data visualization helps transform overwhelming amounts of raw social media data into understandable visual formats. It makes it easier to identify patterns, trends, and insights from billions of daily online interactions.
How can businesses make sense of social media data?
Businesses can make sense of social media data by using data visualization tools and social intelligence platforms. These tools help decode the massive volume of daily interactions into actionable insights for decision-making.
Why is it hard to understand social media data volume?
The sheer scale of social media data makes it difficult to comprehend - with billions of searches, posts, and interactions happening daily across multiple platforms. Without proper visualization and analysis tools, this data remains overwhelming and unusable.